Content analytics
A dedicated dashboard shows how members engage with Kibu’s classes and activities. Navigate to Documentation → Content Usage.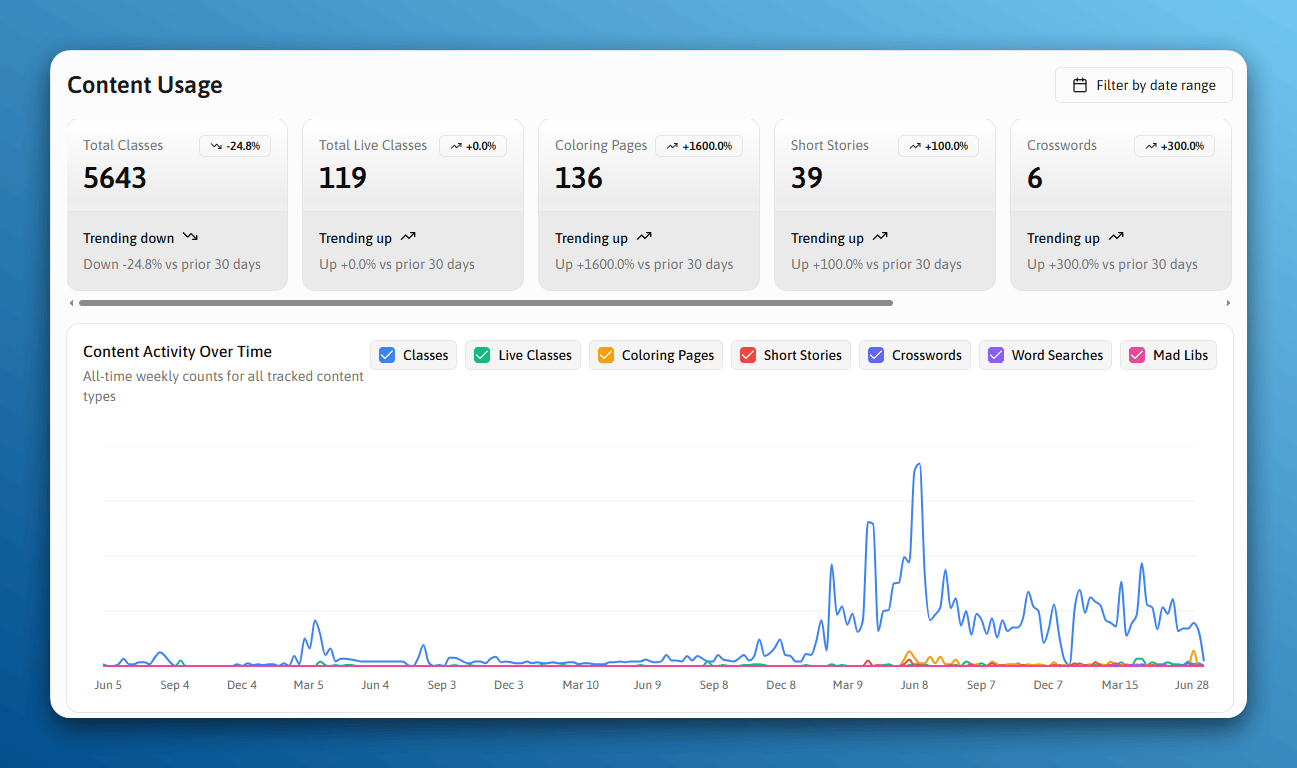
The Content Usage dashboard showing total content counts and content activity over time.
Key metrics
Live stream attendance
On-demand class completion rates
Goal achievement rates
Activity engagement trends over time
Exporting a usage report
1
Navigate to the Usage Report table
2
Select your date range and apply relevant filters
3
Click Download
The report downloads as an Excel (.xlsx) file.