

Who can use this feature?
Staff whose role can view analytics, on the web. Members cannot open Content Usage. To check a role, see Staff Permissions.
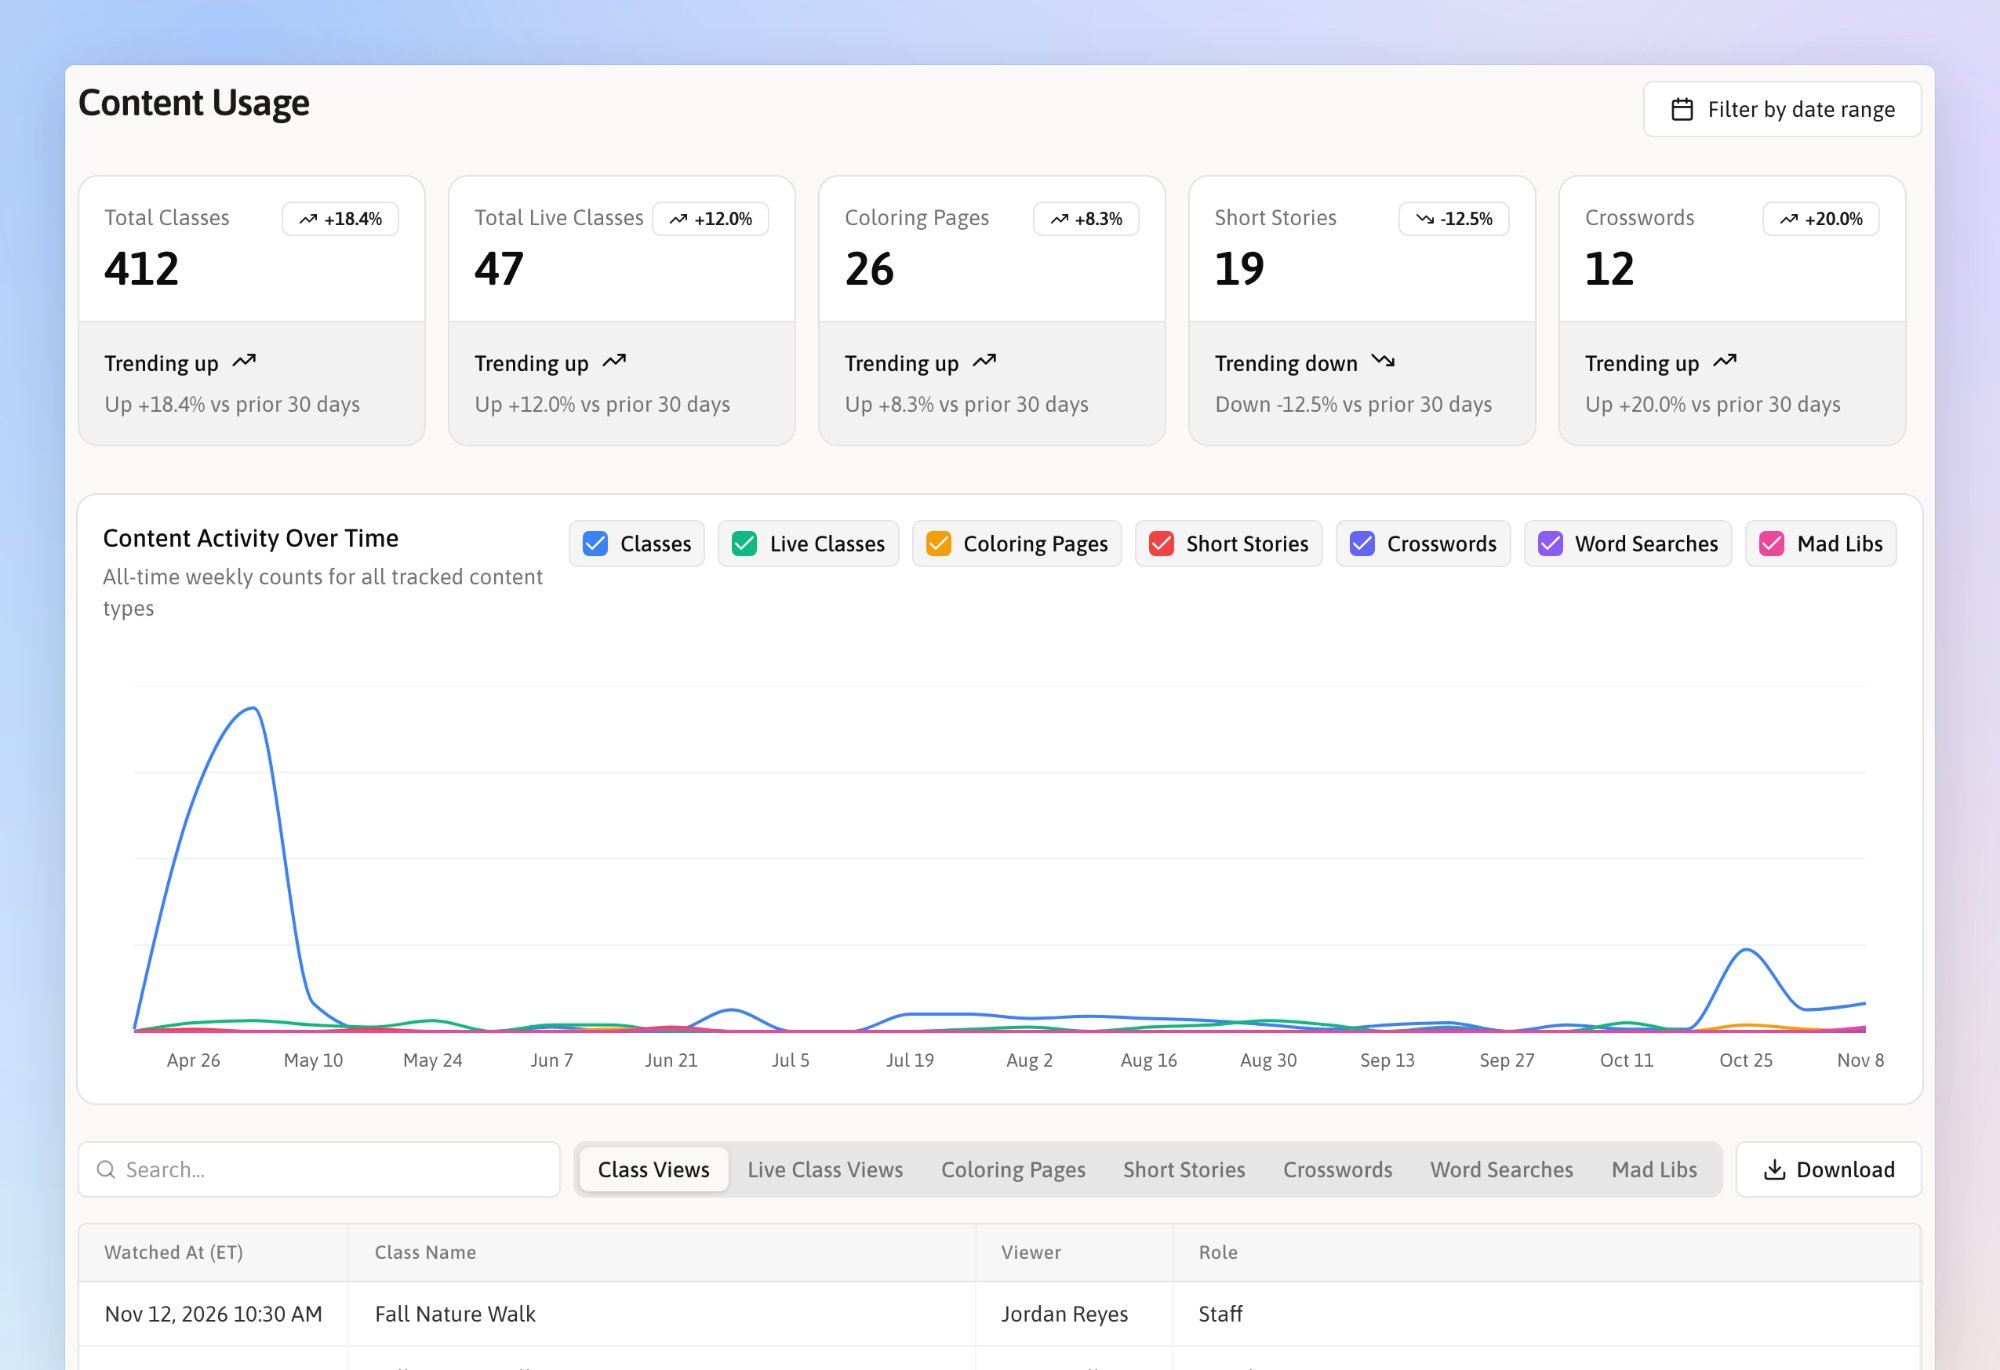
Totals across the top, a weekly chart in the middle, and the full history below.
What you need to know
- Views come from On-Demand Classes and Live Classes. A view counts when someone presses play or joins a live class.
- Creations come from Kibu Create: coloring pages, short stories, crosswords, word searches, and Mad Libs.
- Tracked members are the members a staff member picks when they watch a class together. See Who counts as a viewer.
- Content Usage shows your organization only.
Open Content Usage
Click Documentation at the top of the page, then click Content Usage at the bottom of the left sidebar. On a smaller screen, Documentation is in your profile menu. Content Usage at the bottom of the left sidebar. On a smaller screen, Documentation is in your profile menu.
Pick a date range
The page opens showing all time. Click the Filter by date range box at the top right, then pick dates on the calendar or a preset such as Last 30 days, Last Month, or Last Quarter. The range applies to the whole page: the totals, the chart, and every tab. Click next to the box to clear it. Filter by date range box at the top right, then pick dates on the calendar or a preset such as Last 30 days, Last Month, or Last Quarter.
 next to the box to clear it.
Read the totals
Seven cards show one total each: Total Classes, Total Live Classes, Coloring Pages, Short Stories, Crosswords, Word Searches, and Mad Libs. Scroll the row sideways to see them all. With a date range, the first two read Classes and Live Classes. Each card also shows a trend, such as +12.5%:- With no date range, it compares the last 30 days with the 30 days before them.
- With a date range, it compares your range with the same number of days just before it.
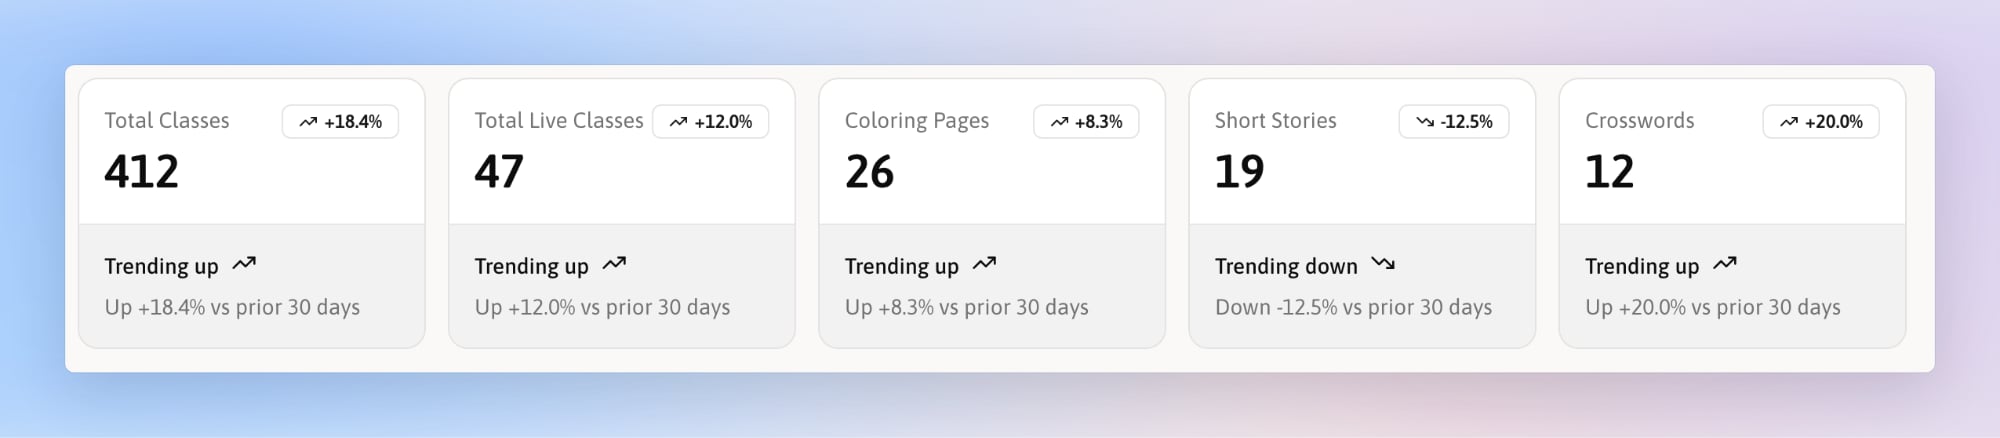
Each card shows a total and how it changed from the period before.
The class cards count each time a class was started. The tabs below count each person who watched. When a DSP plays one class for three tracked members, Total Classes goes up by one and the Class Views tab gets four rows.
Content Activity Over Time
The chart shows weekly counts for each kind of content. Hover over the chart to see a week’s numbers. Click a checkbox above the chart to hide or show that line, for example to compare only Classes and Live Classes.Browse the history
Below the chart, pick a tab. Each one lists every view or creation, newest first. Click a column heading to sort by it.
Times show in your organization’s time zone. Use the search box to find a class, a prompt, or a person by name.
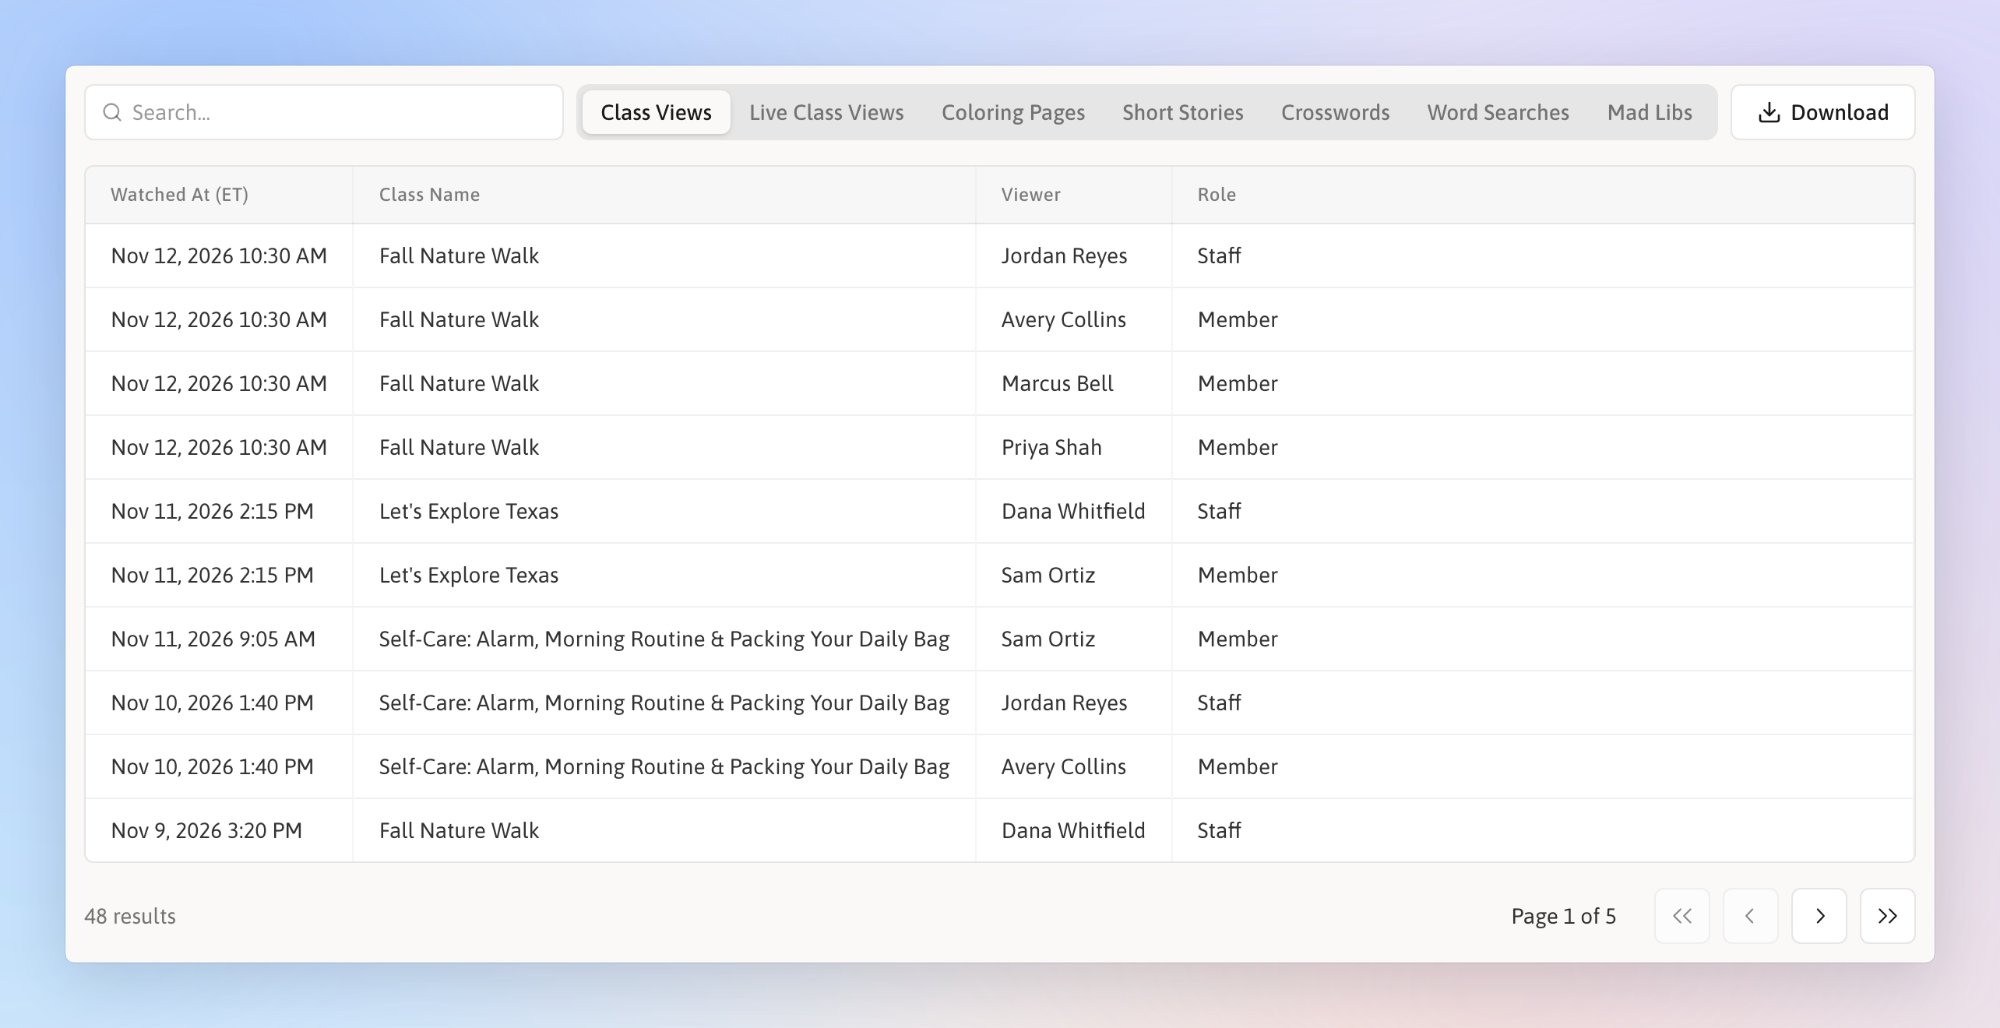
The Class Views tab, with a row for the staff member and each tracked member.
Who counts as a viewer
When you play a class for members, add them under Tracked Members in the window that opens when you pick the class. Kibu gives each tracked member their own view, alongside yours. You can track only members you have access to. A member who signs in to Kibu and watches on their own gets a view without being tracked.Download a tab
1
Set the date range and search
The download uses the same date range and search as the table, so set them first.
2
Click Download
Click Download at the top right of the table. You get an Excel file (.xlsx) with every matching row, not only the page you can see.
 Download at the top right of the table. You get an Excel file (.xlsx) with every matching row, not only the page you can see.
What Content Usage does not show
- How long someone watched, or whether they finished a class.
- Jeopardy games, mazes, classic games, and other Kibu Create tools without a tab here.
- Thumbs up and thumbs down ratings on classes.
- Stories and coloring pages someone deleted from their library. Deleting one also removes it from Content Usage.